
Microsoft Intune Advanced Endpoint Analytics - In Depth Review w/ServiceNow Integration
On March 1 2023 Microsoft released Intune Suite, a new service that encompasses Privilege Management, Advanced Analytics, Remote Help & App VPN. While I would argue some of the other components are more important for enterprise security, for the purpose of this article we will focus on one component, Microsoft’s v1.0 of joining the DEX space!

Here is the best news, the solution is already in your ecosystem and depending on the maturity of the computing environment, it can be clientless and native.
Here are the requirements before we move on:
· Windows 10 1903 devices or later
· Windows Pro Education, Enterprise, or Education. Home and long-term servicing channel (LTSC) aren't supported.
· Microsoft Intune Suite subscription
· Windows devices must be Azure AD joined or hybrid Azure AD joined. Workplace joined or Azure AD registered devices aren't supported (a costly rookie mistake for us).
· Network connectivity from devices to the Microsoft public cloud
As far as licensing, Microsoft changed this twice already so we leave them to decide the future. Our opinion is to separate this great product from Intune Suite (are we following the naming conventions yet?) and give it to E5 customers for no cost. Imagine the things possible….
If you want to do it the Configuration Manager one rather than Intune advanced Endpoint Analytics, these are the requirements:
· A minimum of Configuration Manager version 2002 with KB4560496 and the clients on the same version.
· Microsoft Endpoint Manager tenant attach enabled.
· Enable Endpoint analytics for devices uploaded to Microsoft Endpoint Manager.
You can find this module by going to intune.microsoft.com > Reports > Endpoint Analytics or https://aka.ms/endpointanalytics. Once you are there, if the onboarding has not been started, you will have the opportunity to easily create the “Intune Data collection” policy and target it to the devices you want to include in this module.
Once this has been configured, your existing devices will start reporting to it automatically after 24 hours. As long as new devices fulfill the domain membership and/or conditions mentioned above, they will start reporting automatically as well within 24 hours, compared to other tools, it is amazing that no additional agent or software installation is needed!
Overview
The first screen we will see in there is the Overview one. In here, it will show you the overall score of your environment, breaking down the score into three distinct categories:
· Startup performance: Metrics about the boot and logon time for the devices in the environment.
· Application Reliability: How many times do applications crash on your environment and how often does this happen over a fixed range of time.
· Work From anywhere: Explore latest windows version installed, cloud identity/management/provisioning through your environment.

A particularly useful and advanced capability of this module is the automatic suggestions on what to do to improve the score and overall experience with an exact number of points that the score will be increased if you manage to resolve them. While some of these tips seem almost like an advertisement to use more MS features like autopilot, in case significant problems are detected, it will show you how many devices are impacted and will take you to the proper report once it is clicked.
Unfortunately, it does not filter the results to just show you the devices impacted, and you would need to add the proper columns for better visibility, nevertheless, the devices are sorted from worst to best scores in the specific area.
As can be seen, there are also other tabs, Anomalies section monitors the health of devices in your organization for user experience and productivity regressions following configuration changes. When a failure occurs, Anomalies correlates relevant deployment objects to enable rapid troubleshooting, suggest root causes and remediations. The model scores show you each kind of score per group of devices, there must be at least 10 devices with the same model for it to start working automatically. The last tab shows you each score for each device and if it the score goals are being met; this latest report can be exported easily into a CSV file.
Going back to the general overview, as can be seen on the top right corner of the image, you can set and view different baselines in addition to the default MS defined one. Basically, the baseline is a snapshot of the current state of your environment, this is particularly convenient for tracking improvements over time on all the areas measured by Endpoint Analytics, a regression baseline threshold also exists to choose how far (in percent) a metric can fall below the baseline before reports show that it needs your attention:

To better explain these baselines, let's look at the startup score:

The glider (gray triangle) in the score is the baseline, right now the one selected is the Default one that MS provides, if we switch the choice, we will see it compared to the snapshot taken on March 20. This could be especially useful for reporting and tracking the overall improvement efforts ongoing in each one of these areas.

Startup performance
Unlike other tools, the information of startup performance seems to be accurate as far as extended logon times, which is extremely valuable, in addition to this, many companies have old / outdated / misconfigured Group Policies that might impact severely on the logon time of users, and in this section is fairly easy to spot that, as this is a factor that really affects the User Experience and perception, it's really something to highlight of this tool. As displayed on the earlier screenshot, the startup performance is composed of the weighted score of 2 fundamental areas:
- Core Boot: To calculate the tenant’s score, it calculates an average of how long it takes each device to complete the core boot phase and scores each experience from 0 (poor) to 100 (exceptional). The components of it look at the Average time it takes to reach the sign-in prompt after a device is turned on. Excludes OS update time, it gets split between Group Policy and To Sign-in screen.

- Core Sign-in: To calculate the tenant’s score, it calculates an average of how long it takes each device to complete the sign in phase and scores each experience from 0 (poor) to 100 (exceptional). This is divided into Group Policy, To Desktop and To Responsive desktop times, also in seconds.

Another splendid feature that adds value to this kind of demanded analysis, as it can be easily tracked and detected if a change performed on the environment had a significant impact on the dreaded extended logon times. It supplies a trend over time of these scores, by hovering the mouse on the desired date, you can choose which day to see the scores historically. Not only is average number of restarts of all devices provided but it also shows trend data from the last 30 days. Super Nice!

The model performance tab compares the metrics mentioned above by model, allowing you to see the differences in hardware present in your environment, while the device performance tab does something similar but more granularly, as it provides a score for each one of the devices in your environment:

The startup processes tab provides you with a list of processes that have an impact on at least 10 devices across your tenant.
In our opinion, the last tab is extremely valuable for improving the user experience in the environment, as a particularly good number of times there is no straightforward way to have visibility on how the users reboot their machines or what caused it. The Restart frequency tab provides you with that information and more!


It does not only provide you with the information on the average of restarts of all devices in the selected scope, but it also tells you how each restart was triggered and how it was started along with the trends over the last 30 days!
App reliability score
This section of the tool is intended to assign a score to each application based on how many times they crash in a given period of time versus the usage volume:

In the App performance section, it can be easily reviewed how many devices are running the app, its score, number of crashes in the last 14 days, total crashes and the mean time to failure:

This information can also be viewed and compared by Model, Device, or OS version, having a clear an easy view on what's working best on your environment, extremely useful for diagnosing a wide range of use cases such as: if a new OS is having more problems with specific applications or if old models are having more problems than they should. Differentiating between the performance of different app versions across the environment adds a good amount value to the tool!
Work from Anywhere
This section emphasizes the need of today´s world to be capable of working anywhere, bringing useful insights to visualize your environment cloud readiness and potential cloud services issues. Its metrics include:
- Windows: This score is based on the number of devices with windows up to date. This score can be of great relevance for quickly identifying devices with failed OS upgrades or not supported anymore.
- Cloud Identity: Devices joined to Azure AD or Hybrid Azure ID.
- Cloud Management: Devices managed with a Cloud service.
- Cloud Provisioning: Windows Autopilot or Cloud PC devices.

Proactive Remediations
Last but not least, one of the most powerful, exciting and useful tools inside Endpoint Analytics is proactive remediations. Despite these having been around for some months now, what improved this month is the reporting capabilities of it, as it is easily visible what is being run on your environment, and which of them are running successfully remediating the problem. The prerequisites of this feature are similar to the Endpoint Analytic ones, however here you can include devices that are comanaged, or just AAD registered VS joined. This is a good summary of the requirements as per MS official documentation page:
· You can have up to 200 script packages (There are customers over this Microsoft, but good for most).
· A script package can contain a detection script only or both a detection script and a remediation script.
· A remediation script only runs if the detection script uses exit code exit 1, meaning the issue was detected.
· Ensure the scripts are encoded in UTF-8.
· The maximum allowed output size limit is 2048 characters.
While there are some Out-Of-The-Box script packages, the most value resides in creating new ones. For this you just simply need to click on create script package:

Then enter a Name, description and Publisher of the package. The version is defaulted to one, and what is great about it is it automatically increases each time the PowerShell script is modified:

On the settings section, we have two kind of PowerShell scripts to upload. The “Detection Script” which will be used to decide whether a specific issue is present or not in a device, and the remediation one. In terms of scripting specifics, as mentioned above, for logic to continue from detection to remediation, it requires an exit code of 1 somewhere (Exit 1). On this evaluation, we decided to create a case based on detecting if a device has less than 100 GB available on system drive, the settings look like this:

The detection script verifies the free space in C drive, if its less than 100GB writes to the host (This will be stored in a column that will be reviewed later) the space left and will exit with code 1, meaning it will continue to the remediation part. Once there and as this was just a test, the remediation will try to remove a huge file in c:\temp. After the remediation has been run, Intune will run the detection script once more to verify if the issue has been solved or not.
After this, you can find the option to run as system or current logged on user (this will vary depending on the use case and goal) and one especially important part related to securely execute PowerShell scripts in your environment. Here is how it works:
· If the option is enabled, the script runs using the device's PowerShell execution policy. The default execution policy for Windows client computers is Restricted (Individual Cmdlets can run, but does not allow PowerShell scripts to be executed).
· Scripts built into Proactive remediations are signed and the certificate is added to the Trusted Publishers certificate store of the device.
· When using third-party scripts that are signed, make sure the certificate is in the Trusted Publishers certificate store. As with any certificate, the certificate authority must be trusted by the device.
· Scripts without Enforce script signature check use the Bypass execution policy.
The next step is to create and select scope tags. Then assignments, in this section you can set the frequency on which the script runs (Once/Hourly/Daily) and assign to All Devices / Users or specific groups of devices:


Groups can also be excluded from each one of these script packages and filters can be applied.
The next step is to wait for it to run on the devices, if the schedule is set to run daily or hourly, it reports back at once after the first run, and every 8 hours after it. If the script is set to run once, it reports back immediately. For each script package there is a very convenient summary and a trend chart:

There will be information on which devices did not have the problem defined in the detection script, which ones were remediated, the ones that recurred and the ones that the remediation failed in the timeline. In addition to this, there is a device view, which shows the latest execution information, along with the output of the detection/remediation scripts accordingly, this list can be easily exported into a CSV file:

The review link works to see the full output of the field, as mentioned before, the limit is 2048 characters:

Recurrent issue that cannot be fixed on device:

Device Fixed:

It’s also worth mentioning, that the timestamp of each action is stored in the registry of the machine where it ran, the path is HKEY_LOCAL_MACHINE\SOFTWARE\Microsoft\IntuneManagementExtension\SideCarPolicies\Scripts\Reports
While the execution details and the same results observed on the report are stored in:
HKEY_LOCAL_MACHINE\SOFTWARE\Microsoft\IntuneManagementExtension\SideCarPolicies\Scripts\Execution
The scripts are cached temporarily on the devices on the path: C:\Windows\IMECache\HealthScripts\<ScriptID>\Detection.ps1 or Remediation.ps1 depending on the case.
But what if I want more reports or to integrate with an ITSM tool? The MS graph API can help us with this! But let's start by reviewing the ITSM tool requirements.
Integration with ServiceNow
As seen before, the advanced endpoint analytics component of Intune has many features, but to enhance it further, it can be integrated with any ITSM tool that consumes REST API calls. In this case, we did a small integration with ServiceNow as it is easy enough to set up using event management and it is very convenient for automation and incident deduplication. Prerequisites:
- A ServiceNow instance with the Event Management and Service Graph Connector for MS Intune plugins installed.
- A web services only account with web_service_admin, evt_mgmt_integration and evt_mgmt_admin privileges.
First, the Service Graph Connector for MS Intune to retrieve all Intune assets immediately was configured, using its simple setup function.
The automatic import job was set up to run daily, to make sure new devices from Intune are imported. This is the list that will help us correlate the proper Configuration Items to the ones in the events.

Once we have this setup, we can continue with the MS graph part.
For automating the MS graph pull process in PowerShell, these are the prerequisites:
- Install Microsoft.Graph Module.
- Create an App registration for graph in Azure AD, setup the necessary permissions.
- Setup the client secret and certificate for password less authentication, in this case, a certificate from a public Certificate Authority such as DigiCert is preferred, although a self-signed certificate works too.
- Install the same certificate on the server / computer that the script will run.
Once you complete these steps, the PowerShell script is ready to be built. To connect to the app run:
Connect-MGGraph -ClientID <ClientID> -TenantID <TenantID> -CertificateThumbprint <CertThumprint>
From here, for all the web calls the Invoke-MGGraphRequest cmdlet will be used, the main path is: https://graph.microsoft.com/beta/deviceManagement/deviceHealthScripts
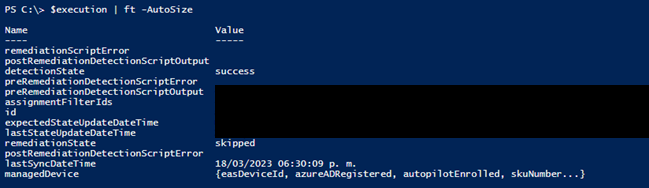
This will provide us with the ID’s of each of the scripts on the proactive remediation part of the tenant. Using the namespace runSummary, it will supply something similar to the report in the Intune web version:

After this, the goal is to iterate through each one of the scripts and depending on the execution remediationState or any other details inside it, send an “Post REST API” call to the event management table in ServiceNow, this is how an execution of a device where C has more than 100 Gb available looks like:
The next step is to create the PS function to send an event to ServiceNow, this is achieved by running the following cmdlet:
Invoke-WebRequest -ContentType 'application/json' -Headers $headers -Method “Post” -Uri https://<InstanceID>/api/now/table/em_event -Body <OutputFromMSGraphInJSON>
The headers will contain the user or authentication profile set up earlier.
As for the body and following the earlier use case about free space, we want to do one of two things here:
- Case 1: If the detection script found an issue but failed to remediate, create an incident for the Field Services team so they can manually clean the drive.
- Case 2: If the detection script found an issue and was able to remediate, create an incident, assign to a reporting queue and auto resolve it, the activity is recorded and can be included in some more advanced reporting / KPI’s.
From the MS Graph output, we will map device name (from the managedDevice component) the type (which is the Scriptname + Action we want to take), the resource is the logged-on user, the PreviousState and NewState.
For Case 1, to cut down on the number of screenshots, here is what our incident looked like once the event / alert / incident flow was completed:


For case 2:


Conclusion
I will let the industry decide what Microsoft is doing here.
Tldr: Update your quadrants…there is a new DEX player in town and it is clientless….